Know each profile’s baseline
Compare total views, median views, engagement, and standout videos and posts in one clear view.
Scan active public Instagram, TikTok, YouTube and X accounts daily, then compare performance charts for videos and posts in Statly Watchlist.
Start tracking from $0 →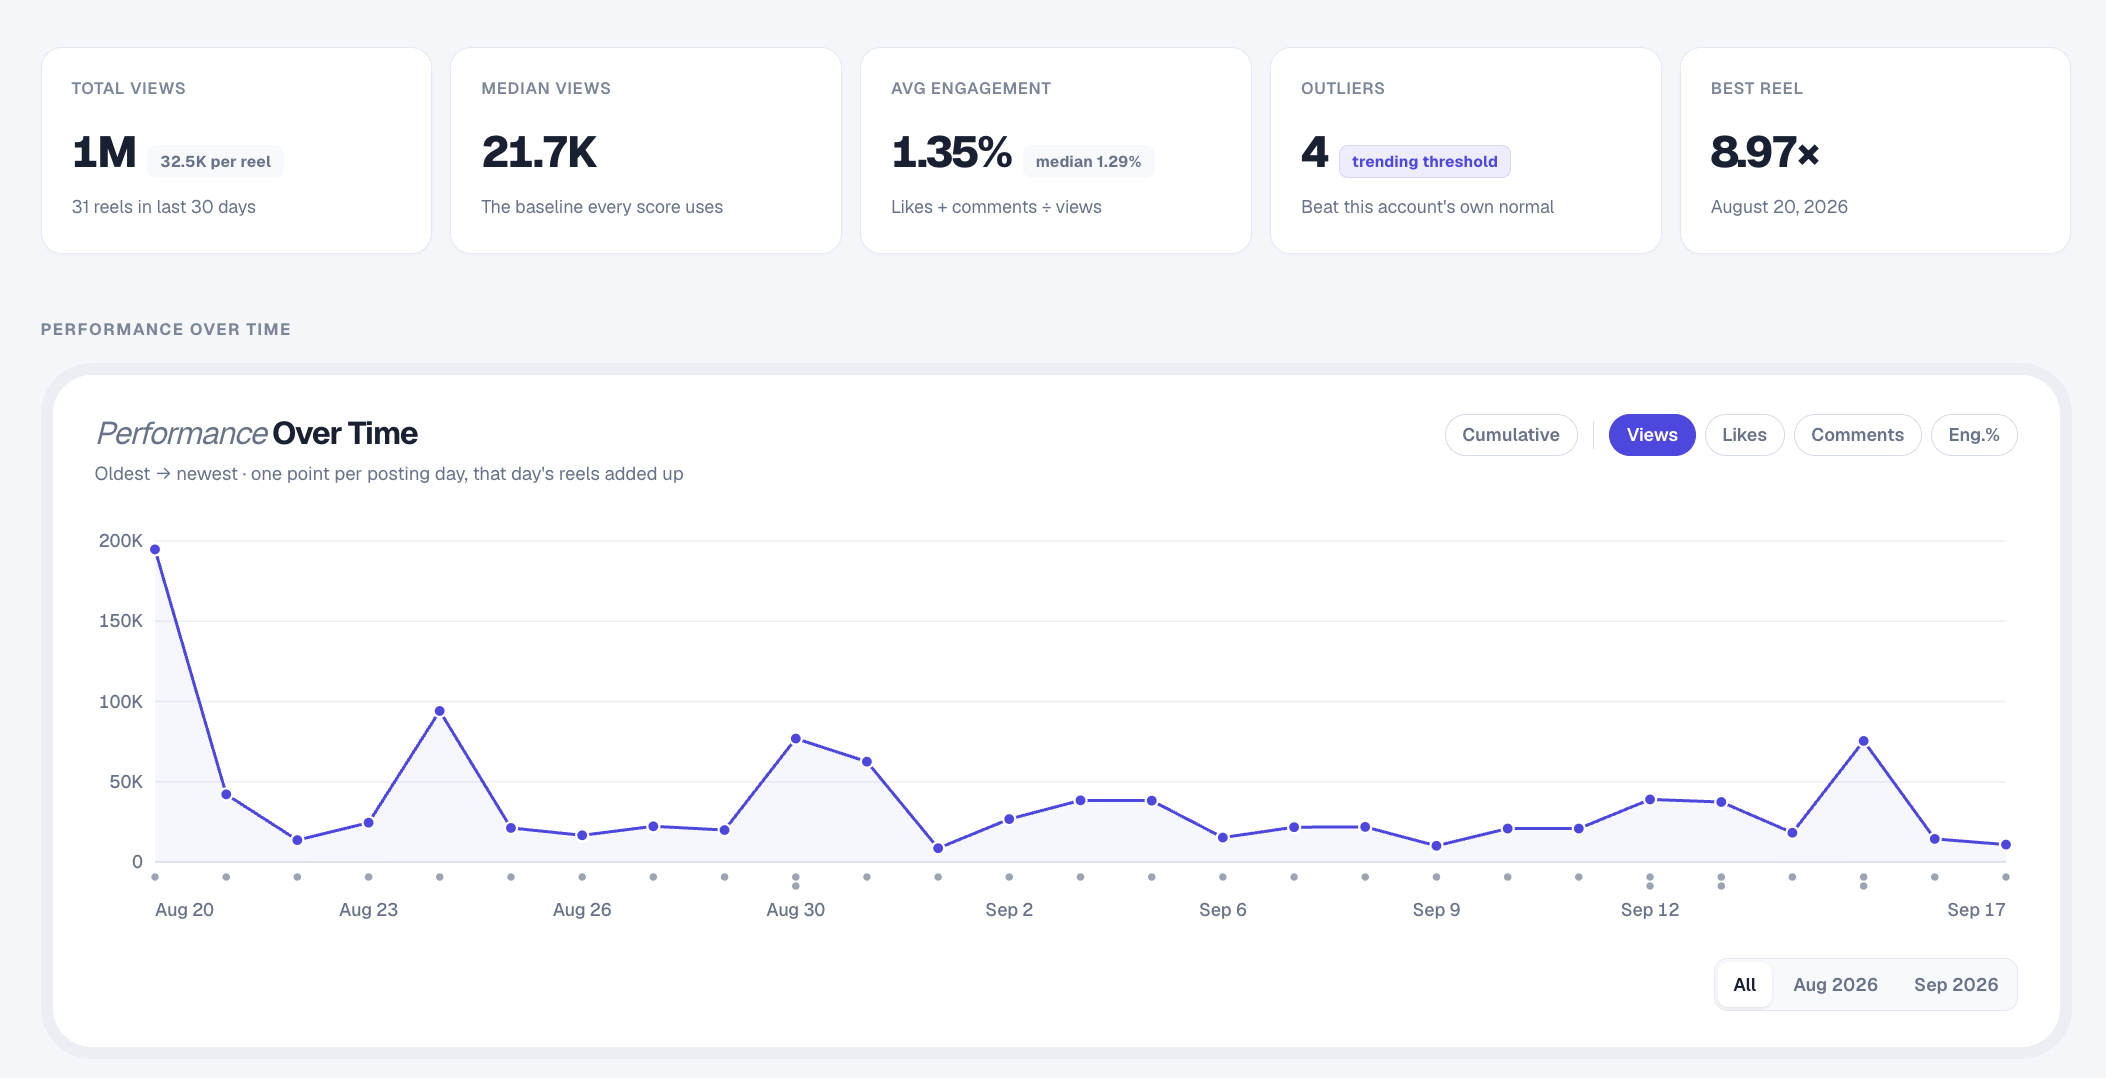
Compare total views, median views, engagement, and standout videos and posts in one clear view.
Review performance trends and posting activity without piecing together separate spreadsheets.
Group profiles by niche, brand, or client, with shared workspaces for your team.
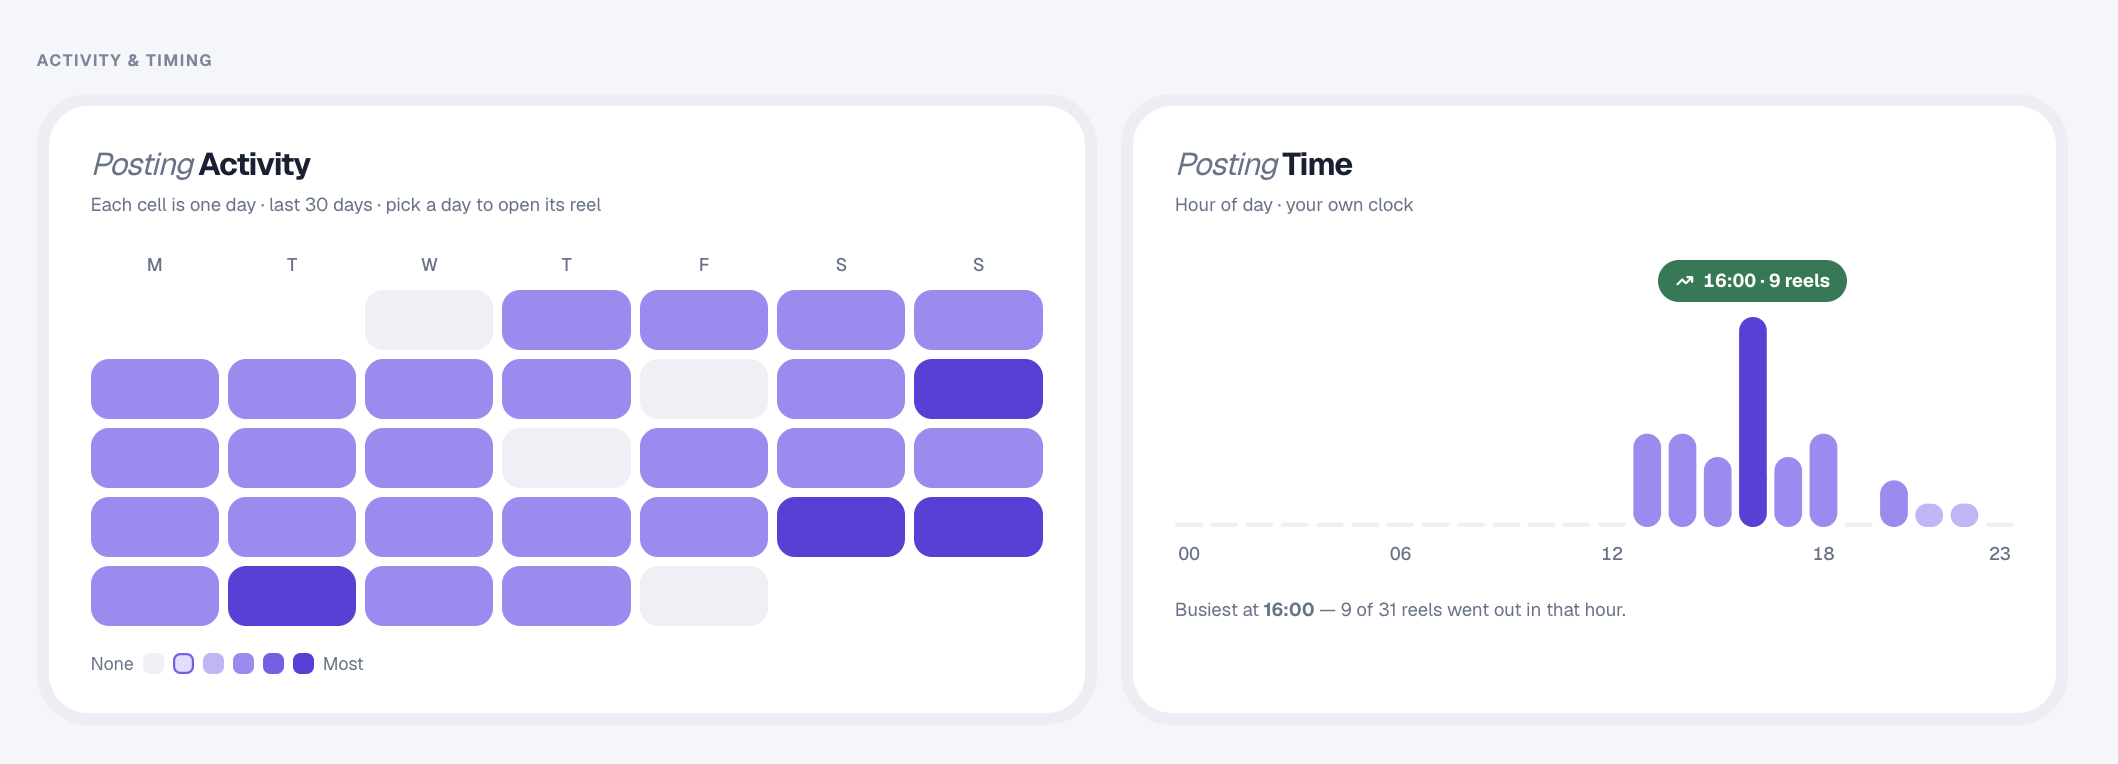
Explore when a profile posts and how its videos and posts perform. Use those patterns to inform your next brief: not as a promise of future results.
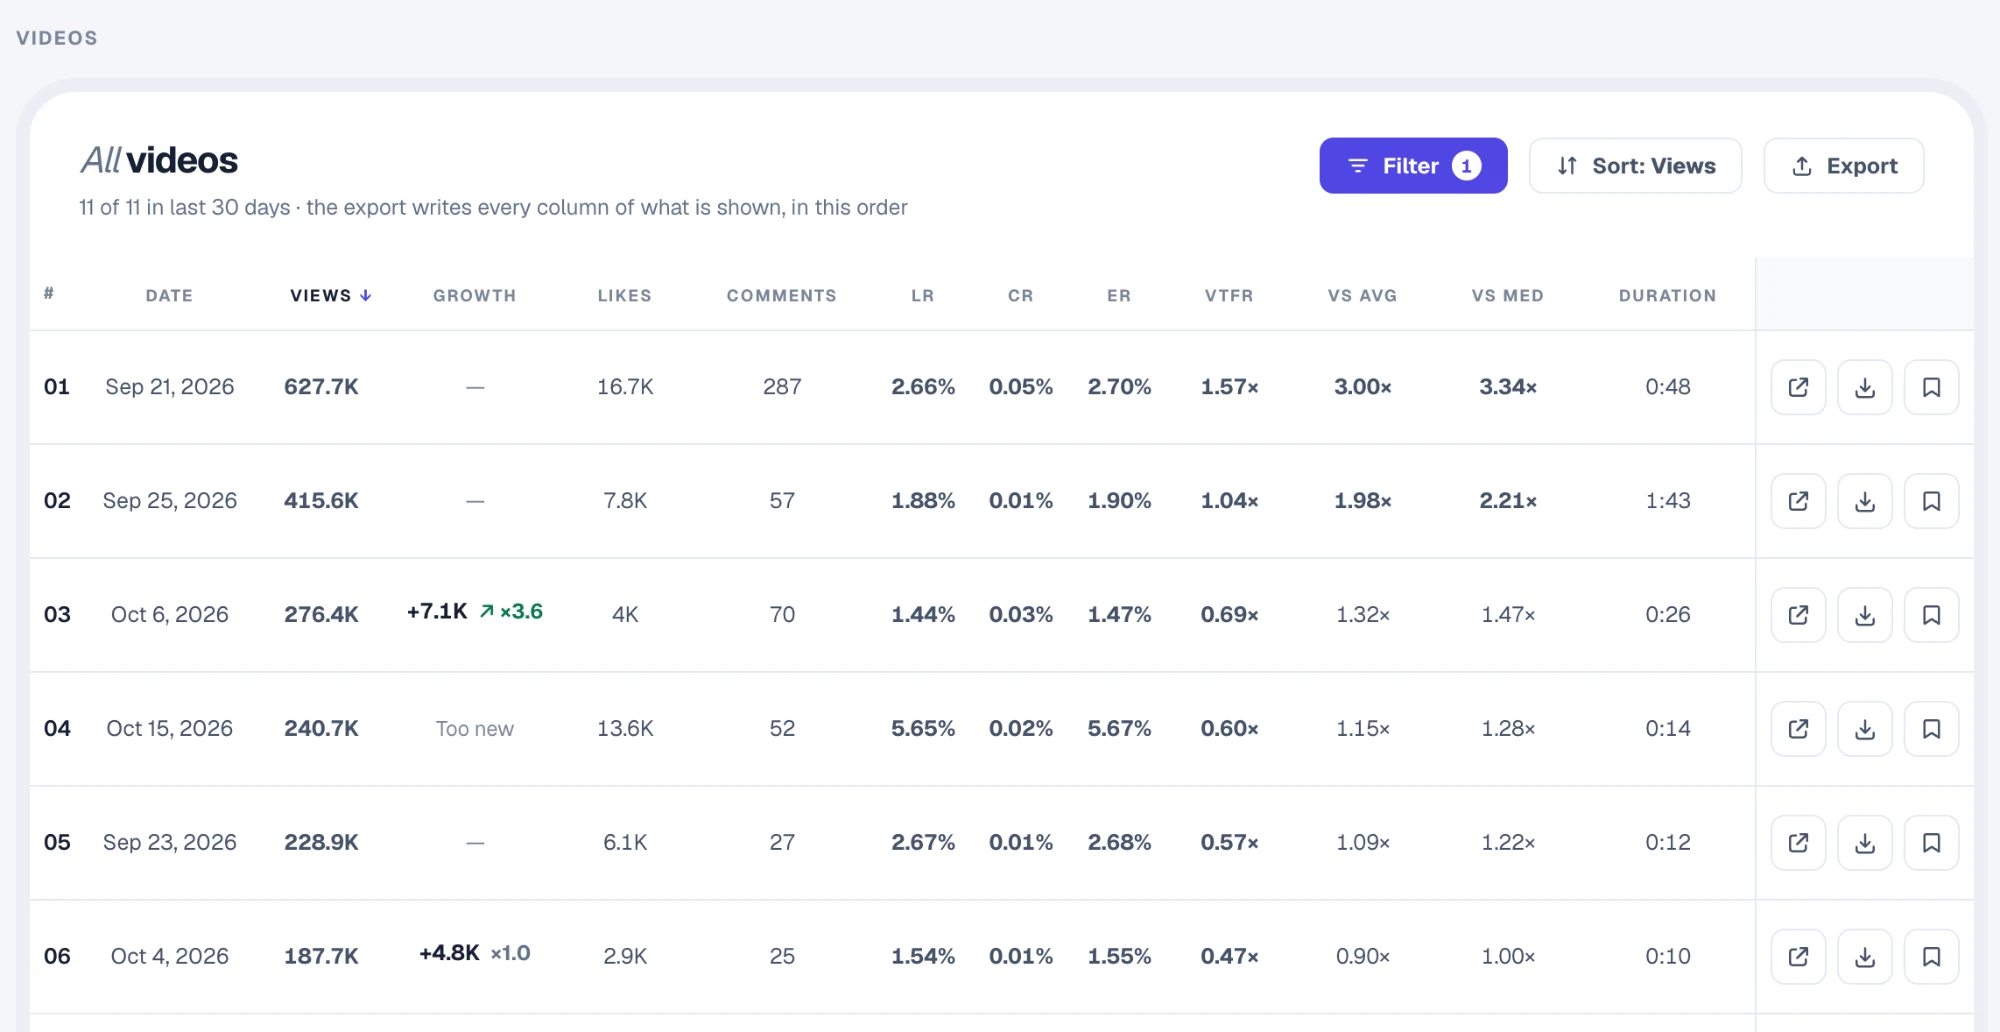
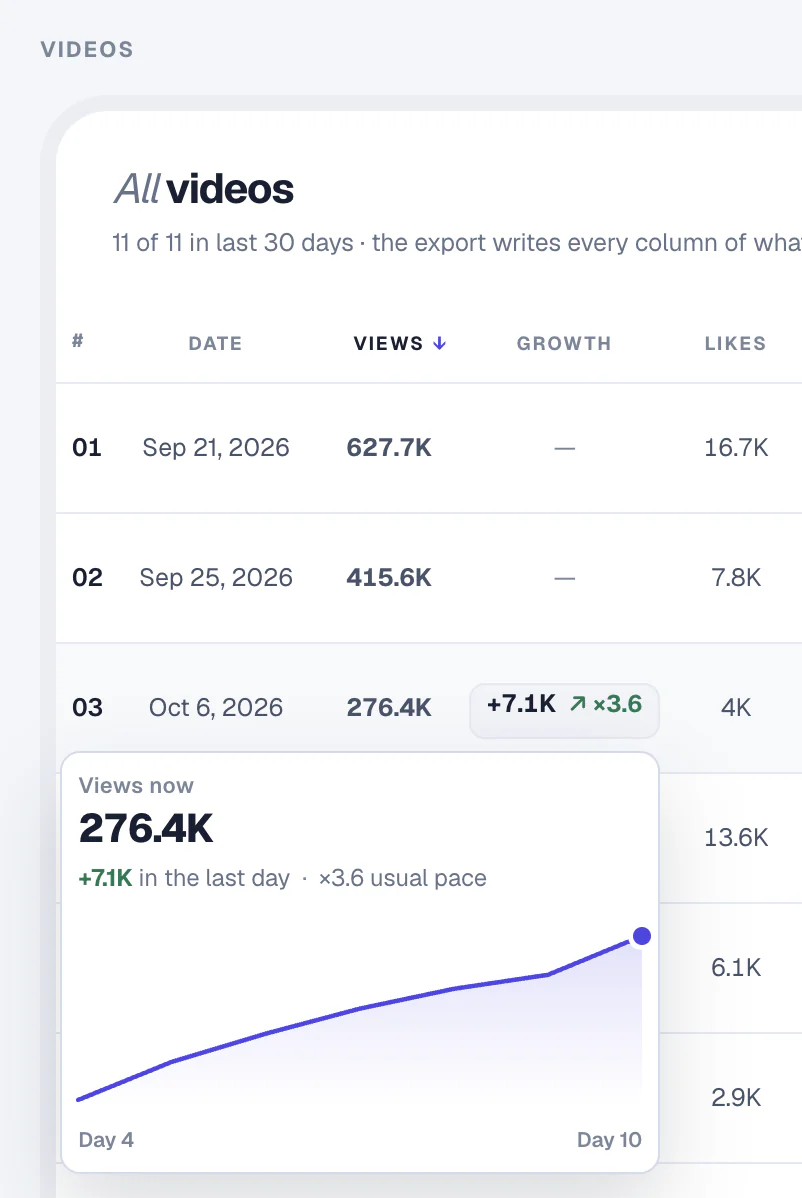
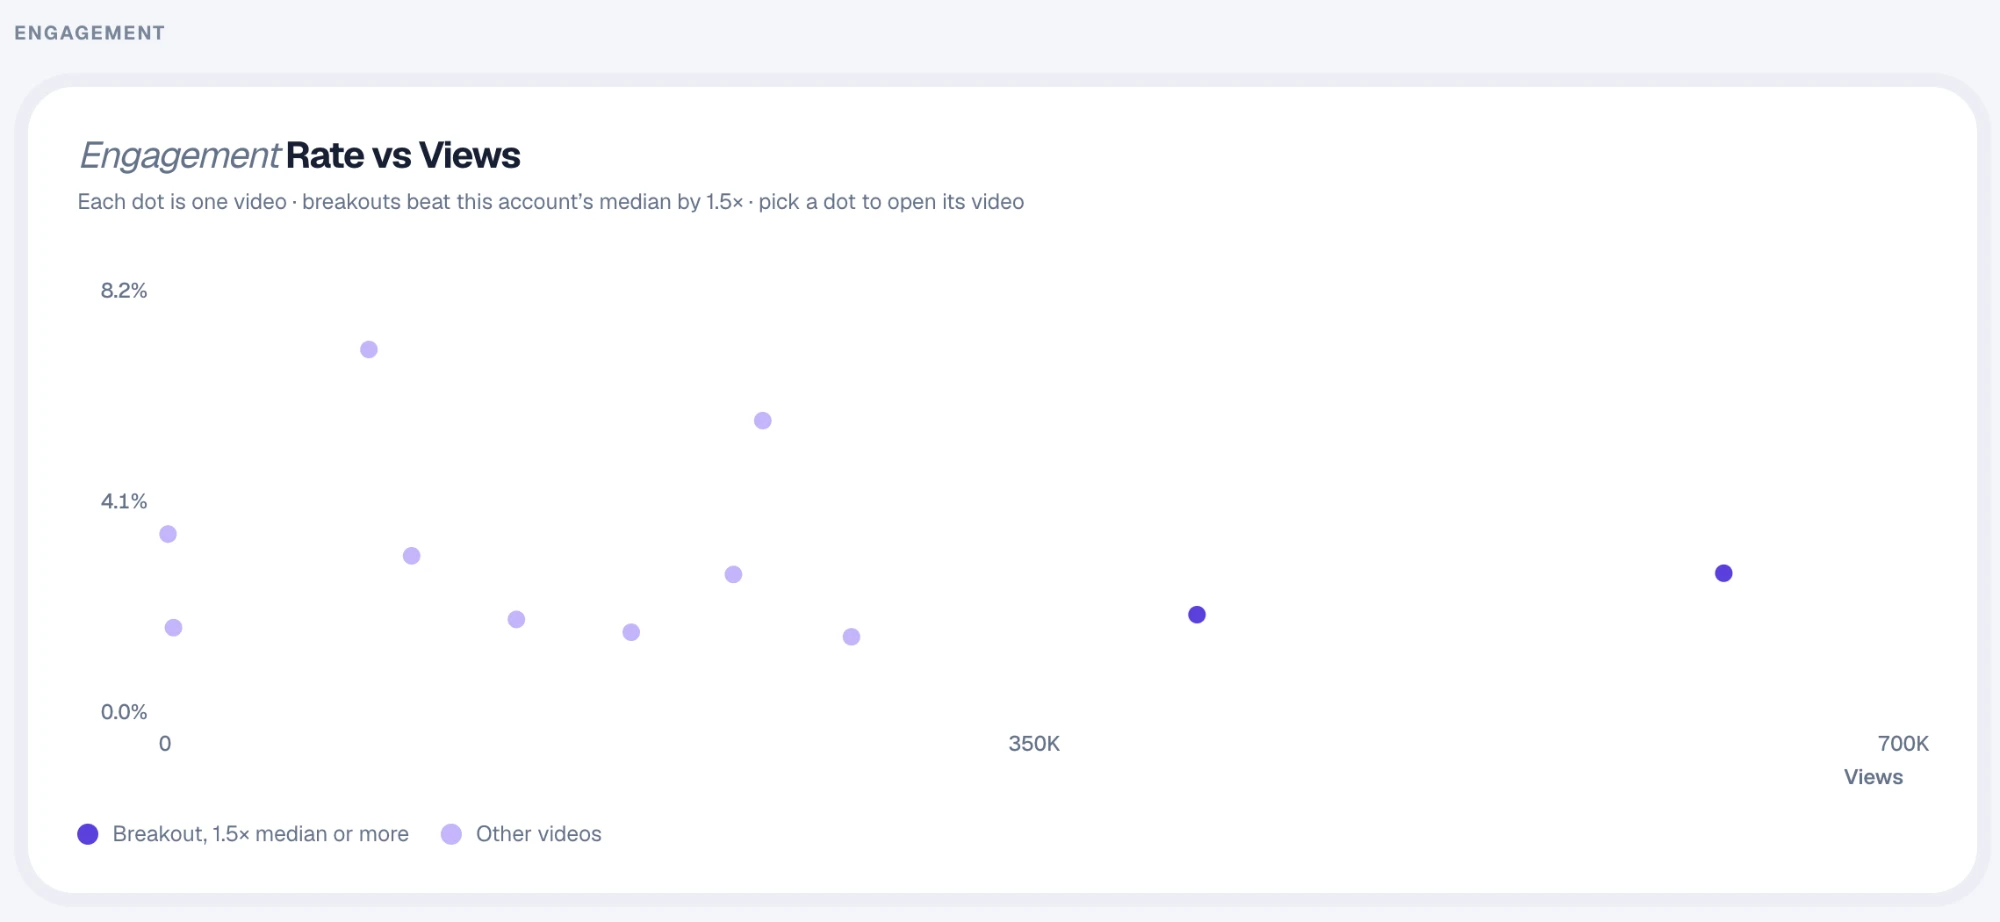
Open any account in your Watchlist to see how its videos perform: engagement, length, reach and breakouts. Then sort, filter and save the videos worth studying.
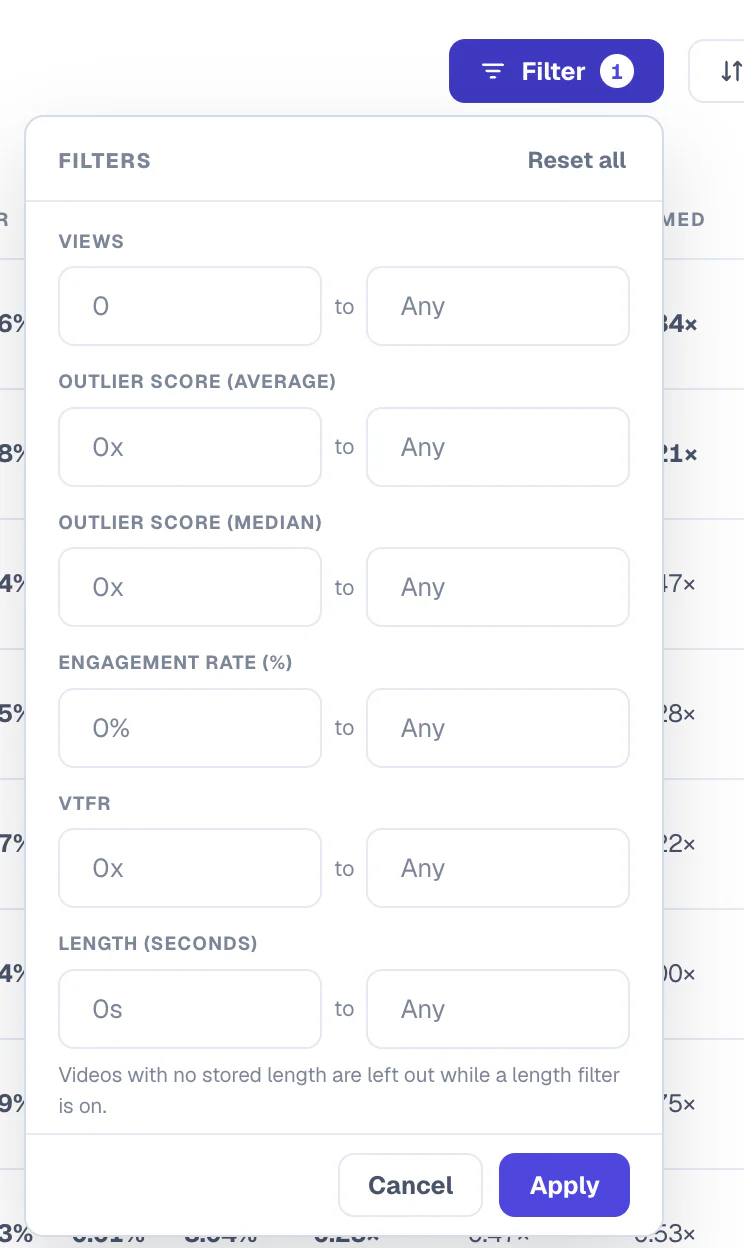
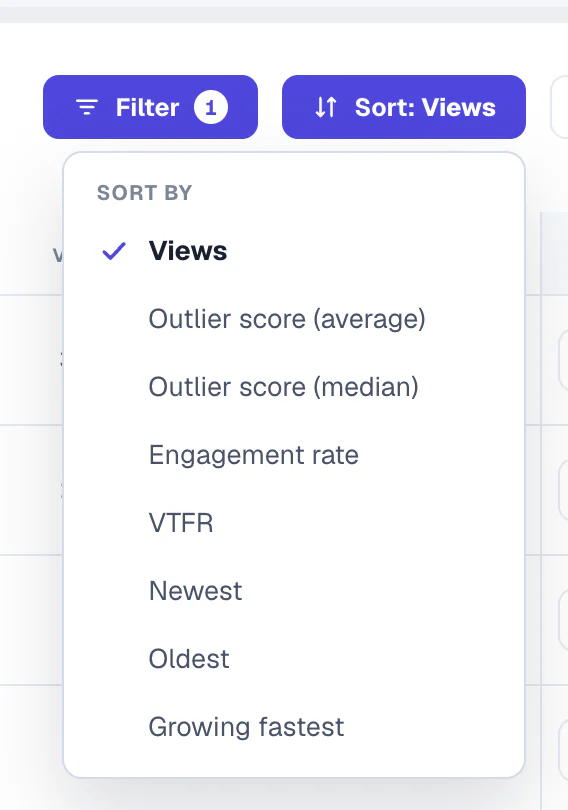
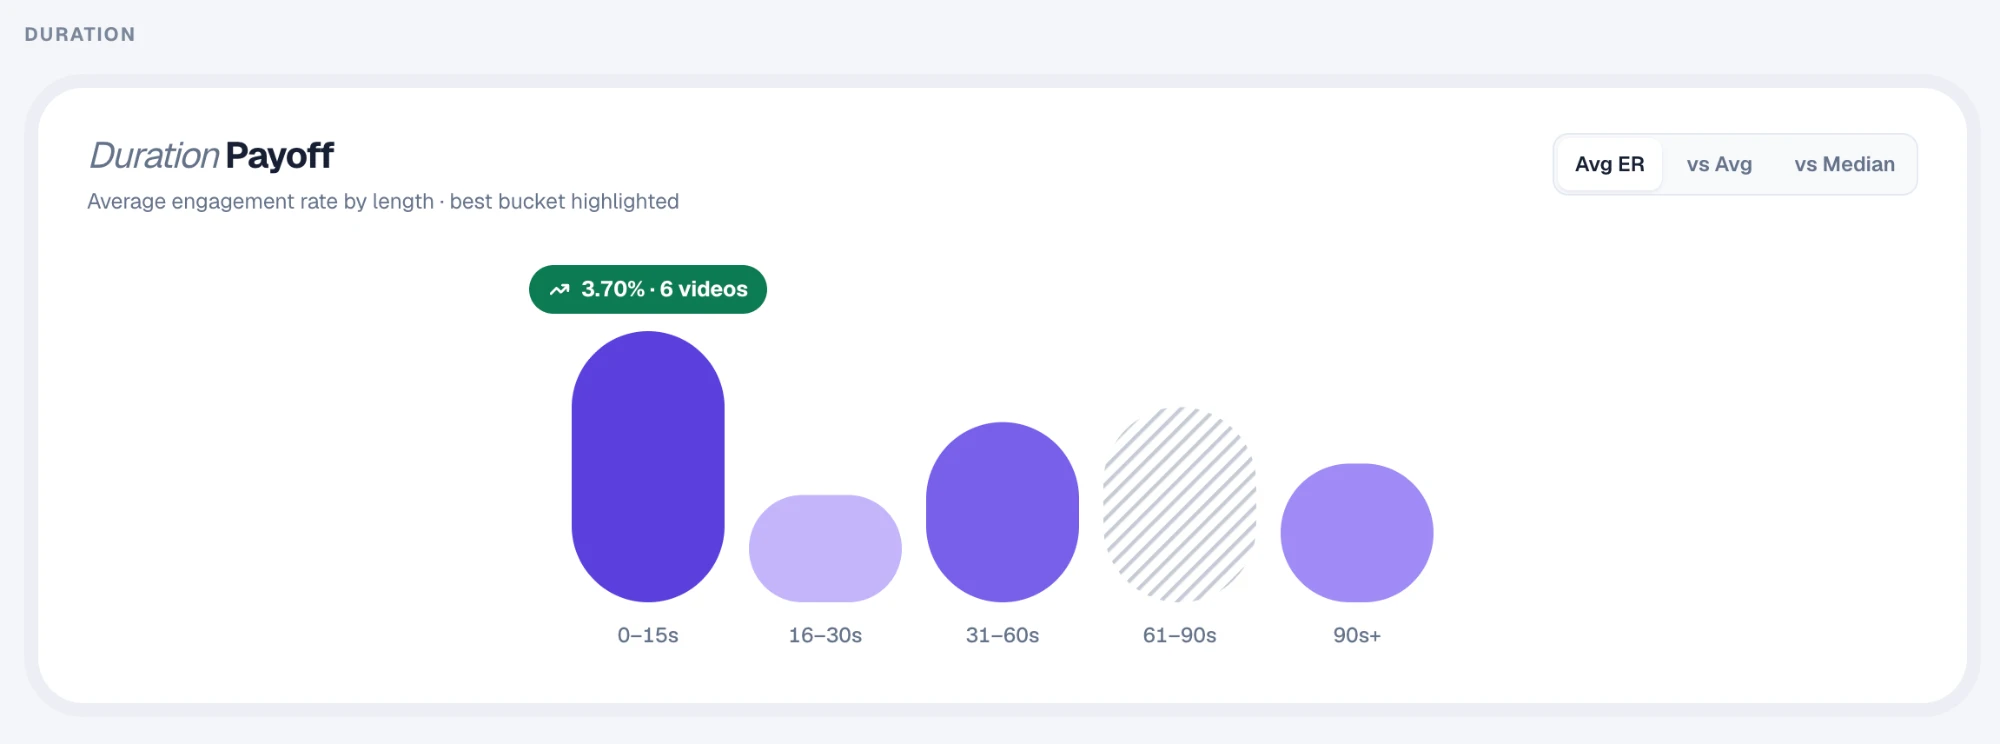
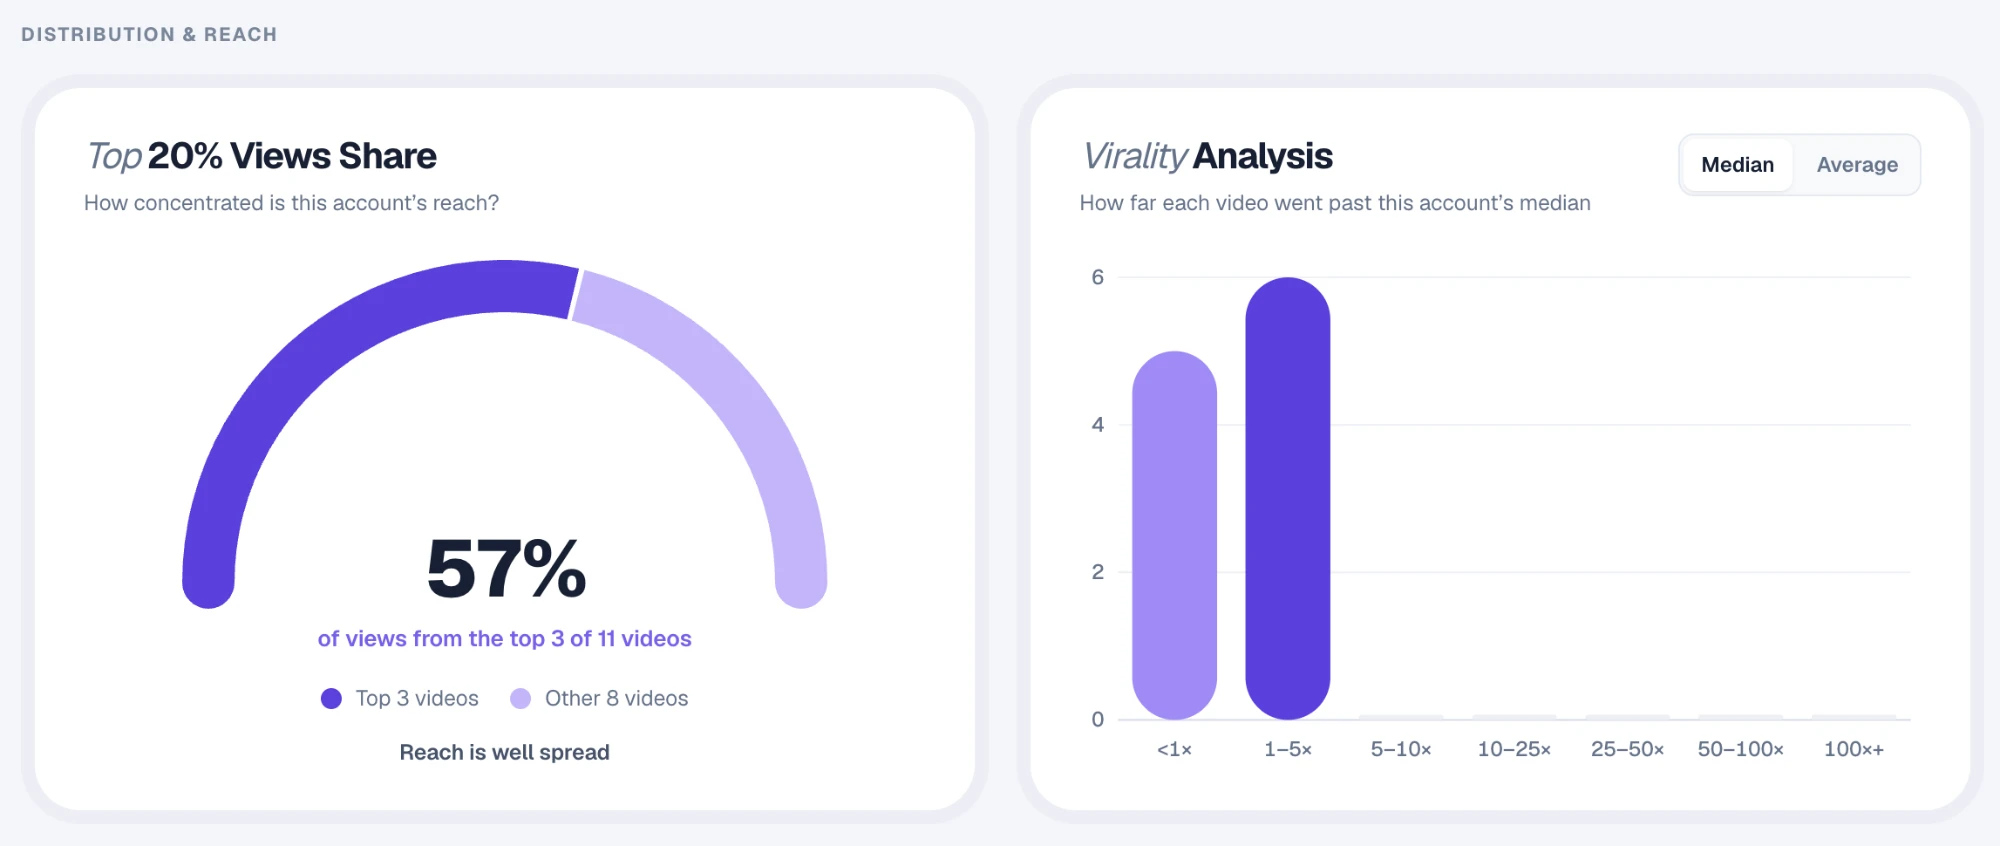
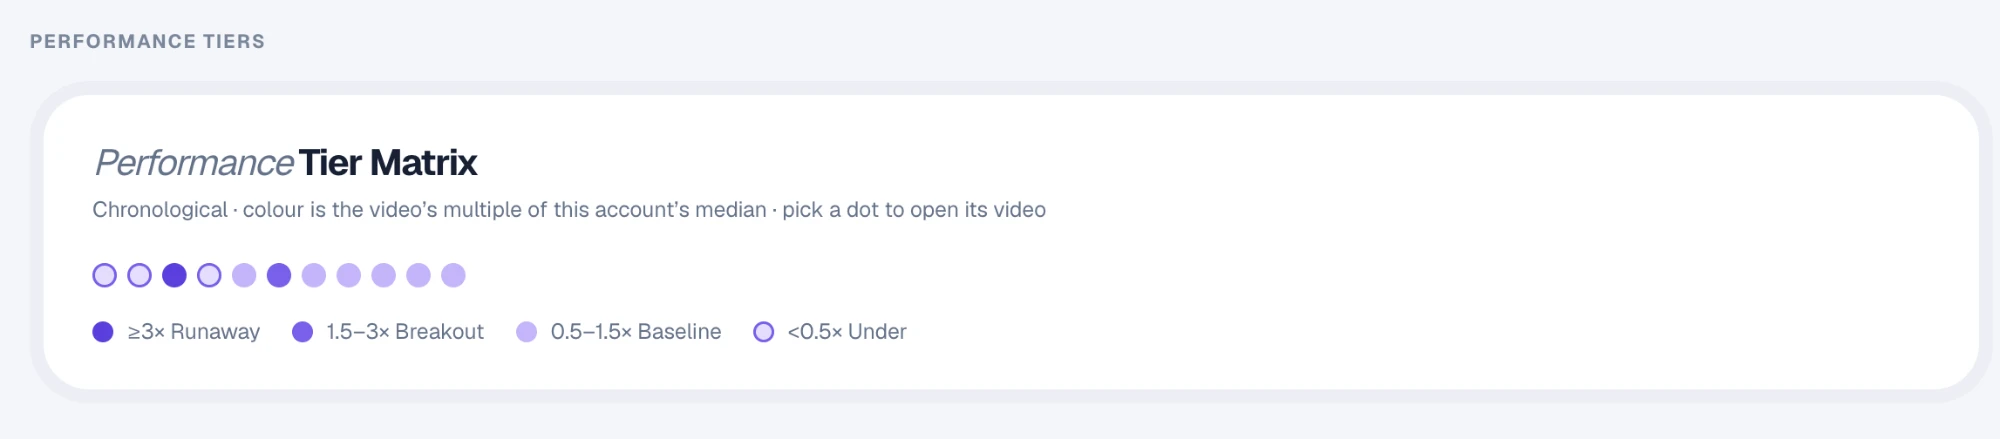
Add public Instagram, TikTok, YouTube and X accounts to your niches and choose your local ready-by time. Active accounts are scanned daily; accounts quiet for 14 days or more are checked weekly. The default scan window is the last 30 days, with 7- and 14-day options in Settings. Your browser can stay closed.
See how it works →Watchlist is where you follow public Instagram, TikTok, YouTube and X accounts in the Statly web app. Each account gets its own page with every recent video’s views, growth, likes, comments, engagement rate and outlier scores, plus charts that show what works for that account.
Active accounts are scanned daily at the local ready-by time you choose. Accounts quiet for 14 days or more are checked weekly. The default scan window is the last 30 days, with 7- and 14-day options in Settings.
They compare a video with the account’s own results. A video at 2.00× vs median got twice the account’s median views. Videos at 1.5× the median or more are marked as breakouts.
Yes. Export downloads the videos table as a CSV file, with every column that is shown, in the same order.
Yes. Group profiles by niche, brand or client, and share a workspace with your team.
Turn the accounts you follow into ideas worth exploring.
Start tracking from $0No card needed · 500 videos · 3 days